As a rule, all Analysen are made up of analyses of subordinate levels (exception: basic elements).
A structure is represented in form of lines (as a list).
The column width of all columns within the Struktur can be adjusted by dragging with the left mouse button. To change the width of one column, drag the boundary on the right side of the column heading until the column is the width that you want. To change the width of columns to fit the contents, select the column or columns that you want to change, and then double-click the boundary to the right of a selected column heading.
You can use the "Spalten wählen" function in the ribbon to show or hide columns.
Blank rows (see also Zeilen bearbeiten) can be inserted into the structure using the context menu, the ribbon, or the keyboard (CTRL+Ins, see Tastenkürzel). After entering a valid code, the Zeit and the standard description appear in the corresponding fields of the row. Anzahl x Häufigkeit and Bezeichnung can be subsequently replaced by the user.
Alternatively, an element can be added to the structure from a data card, the search list, or from another analysis. Functions such as drag and drop or copy and paste are available for this purpose.
The actual time for the row is updated automatically. The sum of all total times at the bottom end of the structure view is also updated automatically.
Below is a description of individual contents of the structure line:
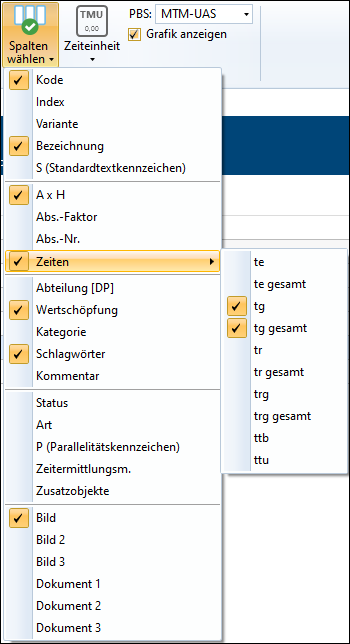
Select columns in the Structure ribbon
Apart from MTM-1®, MTM-2® analyses, or MTM analyses, Formeln can be used in structures, but further entries have to be kept in mind. The structure may be divided into Ablaufabschnitte.
The following specific editing functions are provided for the structure:
•Temporär Zwischensumme anzeigen

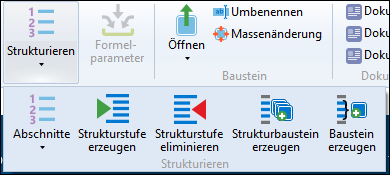
Structure ribbon
Option |
Function |
Refresh |
Recalculates the current element incl. value-added times and time classification. Time and description of the used elements are re-loaded as well. |
New row |
Inserts one or several new rows before/after the current row. The number of rows varies according to the number of selected rows. A new row can also be added by pressing Enter in the last row. |
Delete row |
Deletes the selected row(s). You can also delete them by pressing the Del key. |
|
Opens a window with options for searching and replacing text in the structure. |
|
Moves the selected row(s) up or down. |

Option |
Function |
Structure |
Drop-down button with further options regarding sections and structure levels. |
New section |
Inserts a new section. All rows below will be assigned to this section until an existing section is reached. |
Create section |
A new section is inserted above the selected row. Selected rows will be assigned to this section. |
Insert section |
Inserts a new section. The rows below will not be assigned to this section. |
Sort sections |
(= move line in section) Based on their section number, all structure rows are moved below the section header to which they are assigned. |
Renumber sections |
All section headers are assigned a sequential number depending on their current order. For the rows assigned to a new section, the changed numbers are adopted, so the assignment of the row to the headers remains. Renumbering should always be executed in cases where a new section has been inserted between previously existing sections. |
Reassign sections |
This function assigns all rows under a section header to this section. All assignments set previously are overwritten. |
Sections above |
Displays all section headers above the structure line. This is a temporary setting and is reset when closing. |
Create structure level |
Selected elements are merged into one element, removed from the structure, and replaced by the new element. |
Eliminate structure level |
Removes the selected element from the structure and replaces it with its structure rows. |
Create structure element |
Creates a new empty element and adds it to the structure. |
Create element |
Selected rows are merged into a new element. |
Formula parameters
Option |
Function |
Formula parameters |
Opens a window for entering formula parameters for the selected formula. |
Show graphics
By activating the "Show graphics" checkbox, the structure is graphically displayed below the total row with the description, time, and value added of the individual element rows. The size of the graphics can be changed using the Schieberegler in the status bar.
When using parallelism, the graphic helps to identify the simultaneous processes.
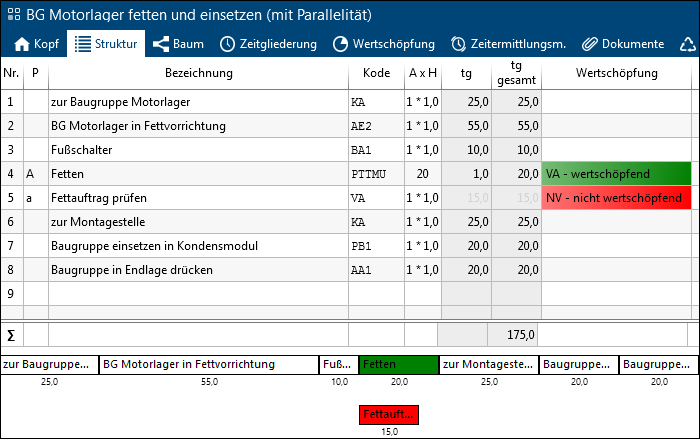
"Grease" (row 4) and "Check grease layer" (row 5) take place at the same time. This can be seen in the graphic.