In each structure, there can be a maximum of three picture tabs per analysis. These tabs can be displayed as columns in the structure of the parent element. If these tabs are filled, the picture or an icon is displayed in the image columns.
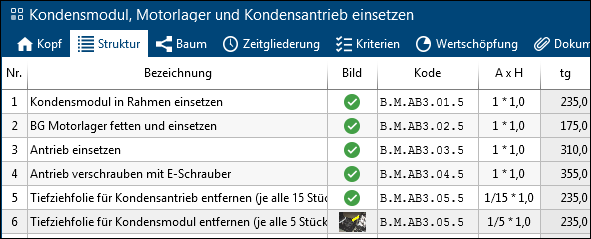
Moving the mouse pointer over the icon displays a preview image in the cell. When moving the mouse pointer over the image preview, the image is enlarged.
Double-clicking on a field in a picture column opens the tab of the corresponding analysis.