Using the Select columns button, the following columns can be activated or deactivated in the Process sections tab:
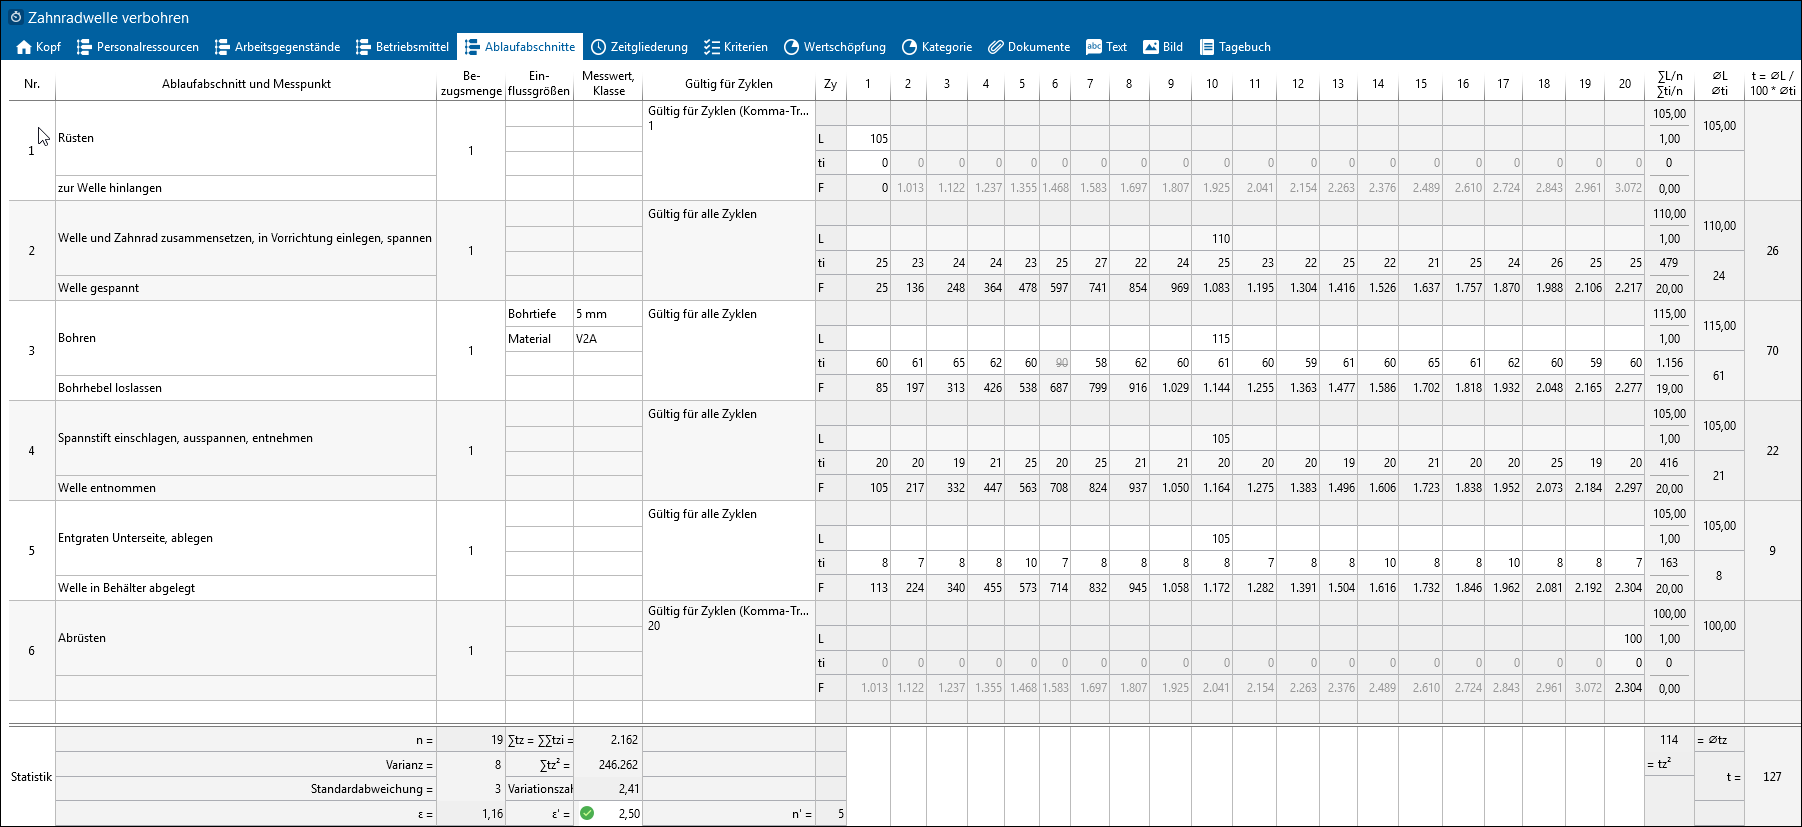
Time study: Process Sections
Column |
Explanation |
No. |
Numbering of process sections |
Section and measuring point |
This column is used to describe the individual sections and their measuring points. Each section starts with a beginning event and stops with an end event. The end event of the section is also the start event of the following section. |
Reference quantity |
The simultaneously edited quantity during a measuring. |
Influencing factors |
Here the most important influencing factors can be described. |
Measured value, class |
In addition to the influencing factors, it is also possible to enter their measured values or classes. |
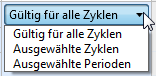
Valid for cycles
|
Here you can choose, for which cycle an entry is valid. |
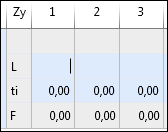
Cy |
Cycle: Each section includes four rows where the following data can be entered: 1st row: Without name 2nd row: Performance level L: Can be chosen in increments of 5 between 70–130 for each measured value. 3rd row: Actual flyback time ti 4th row: Cumulative time F
|
t = ØL / 100 * Øti |
Target time of section Reference quantity is included in calculation Average ti = Total ti / (Quantity n * reference quantity) |
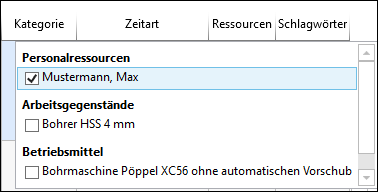
Value added |
Assignment of a value added criterion |
Category |
Assignment of a category criterion |
Tags |
In this column you can add tags. |
Key figures |
|
∑L/n ∑ti/n |
Total Performance level / Quantity and Total Flyback time / Quantity |
ØL Øti |
Average performance and flyback time |
n' |
Number of required cycles for reaching the target value of the confidence interval per process section |
s2 s |
Variance and standard deviation |
v |
Coefficient of variation (v = s / Øti *100) |
ε |
Relative confidence interval in percent per section= actual value ε for 95% confidence level The symbol shows whether the specified confidence interval is reached. Tooltips provide further information on the meaning of the symbols. |
|
|
Here you can choose the resources. |
Time type |
The time type can be set per section. By default, the time type is set to ttb. |
Cycles |
Displays or hides the cycles. |
Documents 1-3 |
If the "Take photos in the app" option is activated in the "Zeitstudie" element configuration in the administration, photos can be taken with the app and transferred to TiCon with the time study. They are created as documents in TiCon. The photos are displayed in the document columns in the "Sections" tab. Any number of photos can be taken. However, no more than three pictures are displayed per section, i.e. the document columns 1–3 are filled. The storage format is as follows: file name-[number of section]-[sequential number]. |
If the statistics are displayed at the end of the table, the following columns are displayed:
Column |
Explanation |
n |
Number of cycles |
Variance |
A measure of dispersion that satisfies several optimization criteria of estimation theory and therefore has priority over the other measures. It is calculated using the square of the standard deviation. |
Standard deviation |
A unit of measurement for the standardized description of the deviation of individual values of a sample from their average value. Often also referred to in simplified terms as a measure of dispersion. Numerical value = root of the total of the mean square deviation. |
ε |
Actual value of confidence interval |
∑tz = ∑∑tzi |
Total of cycle times = Total of all flyback times of all cycles |
∑tz² |
Square of the total of cycle times |
Coefficient of variation |
The ratio of the standard deviation to the mean value is also expressed as the relative dispersion or coefficient of variation. Unit: % |
ε' |
Target value of confidence interval |
n' |
Number of required cycles for reaching the target value of the confidence interval |
tz2 |
Square of cycle times |
Øtz |
Average of all cycle times |
t |
Total of all target times |