When the Assignment tab is open, various settings can be made to facilitate working in the assignment.
View group

View options in the Assignment tab
Group / Buttons |
Meaning |
|---|---|
Select columns |
Show or hide columns for assignment and work contents. The "Type" column cannot be hidden. |
Time unit |
Select the time unit. |
Tree / Diagram / Work contents |
Shows and hides the individual groups. (Tree, Diagram, Work contents= Please note: It is not possible to hide all areas at the same time.
|
Ergonomics |
Shows and hides the ergonomic evaluation. The Ergonomics button is only visible if one of the Calculate ergonomics evaluations options is set in the element configuration in the administration. |
Resource-centered |
Reverses the hierarchy in the display. Personnel and machine resources are displayed at the higher level. Stations are displayed below the resources. Please note: Only assignments can be edited in this view. Stations and resources cannot be added, deleted, or moved. |
Hide placeholders |
Hides the display of placeholders for positions where resources are blocked – for example, when several workers are assigned to an exclusive station or when workers are deployed across stations. Placeholders are completely hidden in the tree and displayed as gaps in the diagram. |
Filter work contents |
Opens the filter functions for the work contents. |
Resources |
Shows and hides resources. |
Diagram group
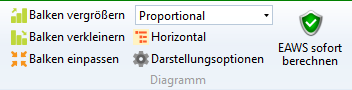
Diagram options in the Assignment group
Group / Buttons |
Meaning |
|---|---|
Increase bars |
Incrementally enlarge the bars in the assignment graphic. |
Reduce bars |
Incrementally reduce the bars in the assignment graphic. |
Adjust bars |
Adjusts the diagram bars so that the entire diagram is visible within the available area, i.e. the bars are enlarged or reduced as required. |
Proportional / Fix element height |
Proportional display of the elements. Elements are displayed regardless of their element time. Each element in the graphic overview has the same height. |
Horizontal |
The graphic is aligned from the left. |
Display Options |
Additional options for the graphical display. Details: see bottom |
Calculate EAWS immediately |
Activates immediate recalculation of the EAWS evaluation after each relevant change. |
Calculate EAWS evaluation immediately
By default, the EAWS evaluation is not recalculated with every change. Automatic recalculation can be activated using the Calculate EAWS immediately button.

Activated Calculate EAWS immediately button
Display Options
The Display options button in the Chart ribbon area offers further options for the graphic display.

Display options button
General

Display options: General
Setting |
Effect |
|---|---|
Draw total time per resource |
All times of a resource are added together and displayed as a block. |
Highlight overload |
If the times of the assigned elements are greater than the cycle time, the corresponding operators are highlighted with a hatch in the chart. Overloaded resources are also highlighted in the tree |
Display code/index/variant |
Controls the display of the code, index, variant of an element in the chart |
Display description |
Controls the display of the description of an element in the chart |
Display times |
Controls the display of the times of an element in the chart |
Time lines
By default, the actual cycle time is shown as a red line, and the target cycle time is shown as a purple line in the assignment. Additional time lines can also be configured. It is also possible for the time lines to be predefined and fixed in the element configuration via the administration. You can choose between relative (value in %) or absolute (value in set time unit) as the calculation type. Both values refer to the cycle time. While a specific time is entered for an absolute value, the percentage of the target cycle time is entered for a relative value. The colors are freely selectable.
If any active time line is exceeded for a resource, a yellow exclamation mark is displayed on the resource in the tree and in the chart. A corresponding message appears in the tooltip.
Warning: |
|---|
Changes to the timeline settings apply to the entire element configuration, not only to the open balancing. |

Settings: Time lines
Further options
Split assignment
The size of the work areas can be adjusted using the window splitters that appear when you move the mouse over the boundary lines.

Change the size of the areas
Expand and collapse resources (stations, personnel resources)
To ensure a clear display, resources such as human resources (operators) or stations can be collapsed and expanded.
This works both in the tree view and in the chart. The change is then made at the same time in the other window. If a station is collapsed in the tree, it is also collapsed in the chart at the same time.
Collapsing and expanding resources always affects the variants in the case of mix and maximum balancings.
Please note: |
|---|
If several human resources (operators) are assigned to a station, it is possible to collapse or expand only individual operators. |
Procedure:
a) Arrow icon  Click to the left of the resource name.
✔ The resource is collapsed/expanded in the tree and diagram.

Collapsed station/operator

Station with one collapsed and one expanded operator
Collapse and expand multiple resources
Procedure in the tree view
1.Select any resource with one click
2.Call up the context menu with the right mouse button
3.Select tree
4.Select Collapse"/"Expand
5.Select All / Sublevel / All sublevels
☐ All resources/all sublevels of the selected resource/all sublevels of the resource are collapsed/expanded.
Procedure in the chart
1.Select any resource with one click
2.Call up the context menu with the right mouse button
3.Select graphic
4.Expand all stations
✔ All resources are expanded
5.Collapse all stations
✔ All resources are expanded
Please note: |
|---|
Resources can also be hidden and then appear neither in the tree nor in the chart More about this: Show or hide resources |
Chart display
The chart can be displayed both horizontally and vertically.

Horizontal chart

Vertical chart
Color coding
If an analysis is assigned the Color criterion [COLOR], it is displayed in the corresponding color in the assignment (see chapter Criteria under Administration).

Color coding in an analysis in the tree view
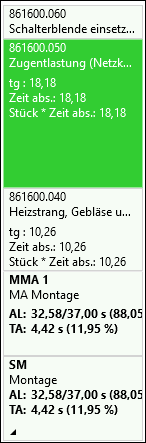
Color coding in an analysis in the chart view

Color coding of a resource