In the Comparison tab, the ProKon analyses listed in the Analyses tab are evaluated.
Note: |
If you have also entered assembly steps manually in the Analyses tab, they are not taken into account in the Comparison tab. |
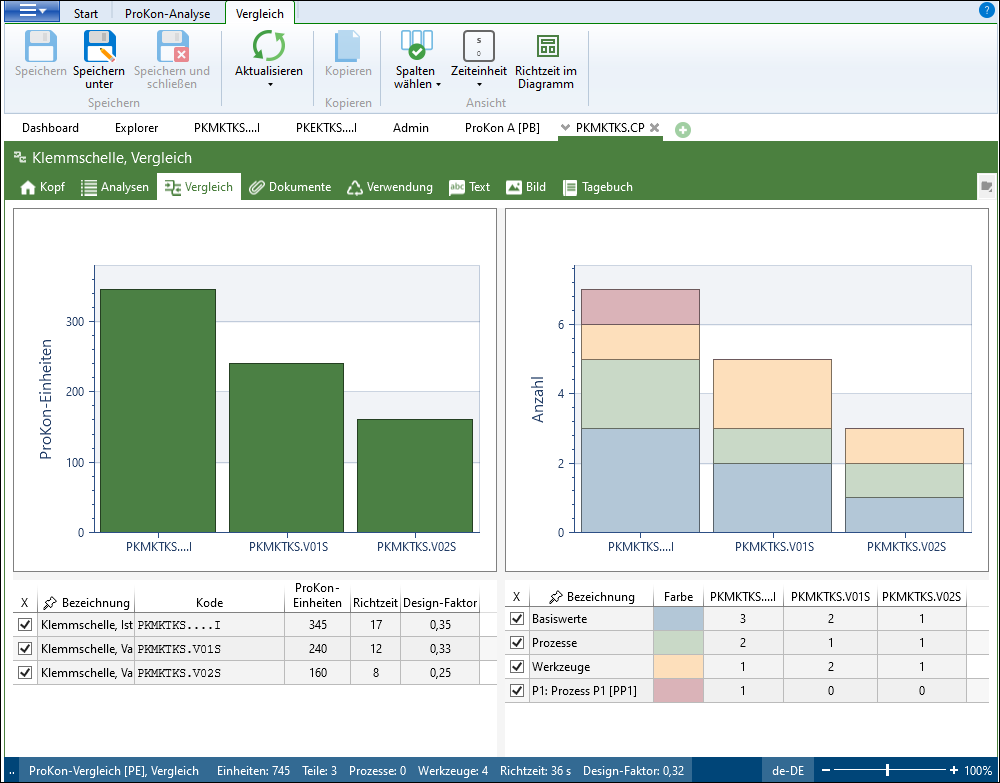
Comparison tab
The tab is divided into four areas:
•Top left
| Chart with ProKon units with percentage in brackets (and target time if enabled in the administration) in the tooltips of the bars. The chart serves to compare different alternatives. |
| The percentage is always compared to the first analysis from the "Analysis" tab. This analysis defines 100%. |
Note: |
To change the chart display, click the "Target time in chart" button. Depending on whether the target time is on or off, the axis label changes between target time or ProKon units. The button is only visible if the "Target time visible" option is active in the administration of the element configuration. |
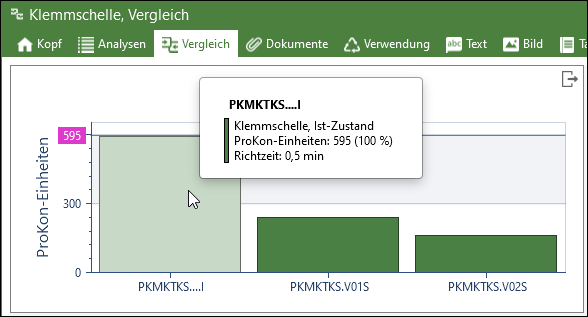
Chart with tooltip at the top left
•Top right
| Chart with number of basic values, processes, tools with percentage share in brackets in the tooltips of the bars. The numbers displayed are determined by the list at the bottom right. The list at the bottom left determines for which ProKon analyses the numbers are displayed. The chart is used to evaluate the analysis criteria in the different analyses. |
| The numbers shown in the chart are displayed in color. The color corresponds to the colors in the table at the bottom right. |
| The percentage is always compared to the first analysis from the "Analysis" tab. This analysis defines 100%. |
Note: |
In the charts on the left and right, only the ProKon analyses selected in the table at the bottom left are displayed. By default, all are selected. |
•Bottom left
| Table for selecting the ProKon analyses to be displayed in the chart |
•Bottom right
| Table for selecting the columns to be compared (influencing factors / categories): |
•Basic values = Sum of all numbers for weight of 1st Positioning location < 8 kg and weight of 1st Positioning location > 8 kg
•Processes = Sum of all numbers for P1, P2, P3
•Tools = Sum of all numbers for tools
•Dynamic list of all processes that occur in the assembly steps of the used ProKon analyses
Note: |
Only the selected numbers are displayed in the chart. By default, basic values, processes, tools are active. |
| The selection of the number to be displayed is saved per element configuration and user. |
The size of the areas can be changed both horizontally and vertically using split bars.
It is also possible to save the charts of the comparison as pictures. When you move the mouse pointer over the bar chart, an "Export" icon appears in each upper-right corner. Click on the icon to save the picture as a *.jpg or *.bmp file.