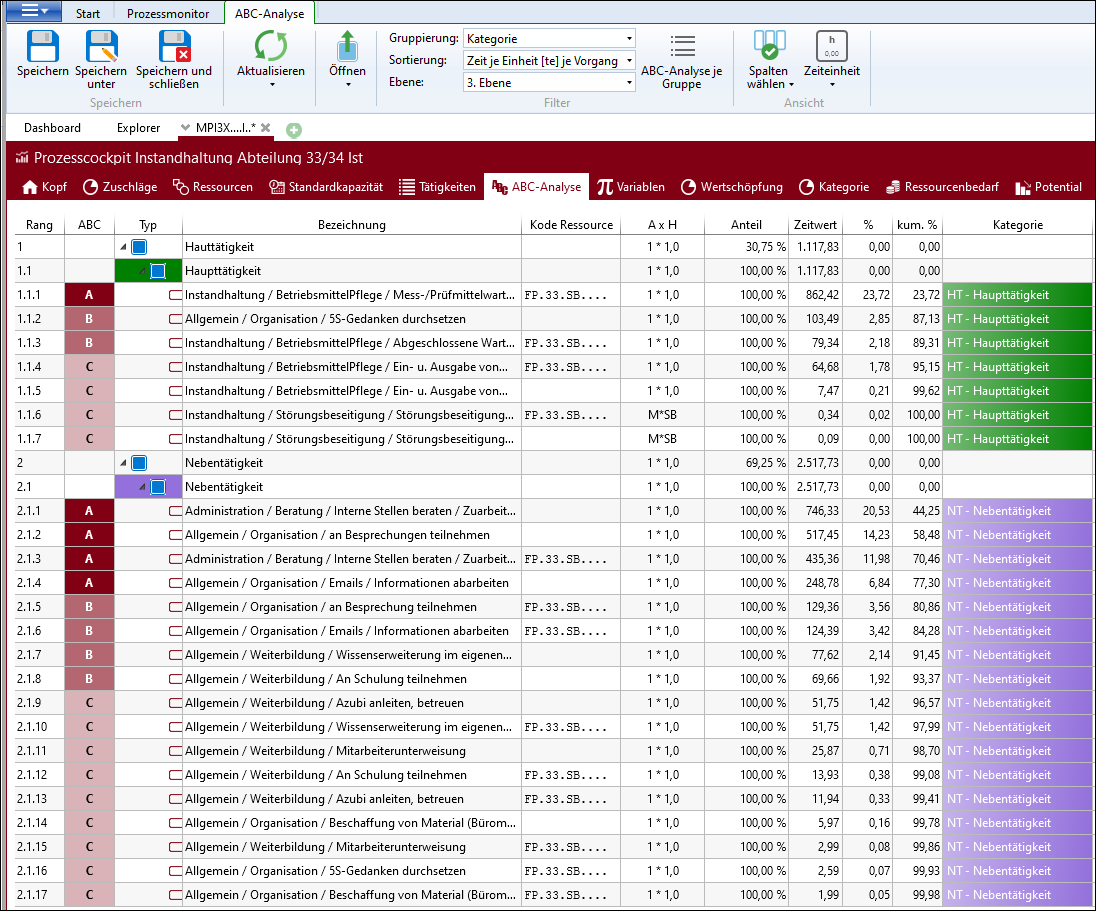
The ABC analysis is used for the classification of the operations, grouped according to category or resource.
The calculation of the rank is made according to the time value. In the "ABC analysis" tab, the hierarchy is displayed in the description. Using the "Expand" and "Collapse" context menu functions, it is possible to expand or collapse "All", "A sublevel" or "All sublevels".
In the Filter area in the ABC Analysis ribbon, it is possible to manage the view of the tab according to different aspects:
Menu item |
Meaning |
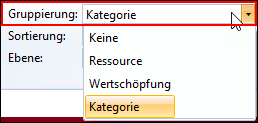
Grouping |
Define grouping |
|
Determines the grouping of single ABC analyses. •None: All processes are considered and displayed as a flat list. •Resource: The presentation is made as tree. The top-level entries are the resources that are displayed according to the order in the "Resources" tab (in addition to an entry for not assigned, uppermost). The relevant processes are listed below in a separate ABC analysis per resource. •Process indicator: The presentation is made as tree. The top-level entries are the categories; the next level are the criteria. There is one ABC analysis for each criterion. |
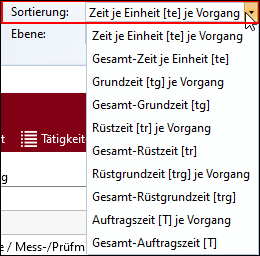
Sorting |
Define sorting •The list / tree is always sorted in ascending order according to the ranking (highest time on the top). |
|
Defines the time which is used for classification. |
Level |
Define level |
1. Level ... n level |
Defines whether the ABC analysis shows all details or only the summarized tasks (if summarized). A maximum number of levels is displayed, according to how they have been created in the Operations tab. |
ABC analysis per group |
If active, an ABC analysis per group is performed (operations of one group = 100%). Otherwise, the ABC analysis is performed for all operations (all operations = 100%) and displayed as a group. |
The columns of the ABC Analysis:
Column |
Explanation |
||||||||
Rank |
Indenture number, according to which the values are sorted. |
||||||||
ABC |
Classification acc. to ABC Analysis (Limits: 80% and 95%)
|
||||||||
Type |
Shows the type of the single rows as icon. |
||||||||
No. |
Number corresponds to the row number of the Operations tab (inactive by default) |
||||||||
Code, Index, Variant, Description |
Shows the Code / Index / Variant or description of the resource or the description includes the path of the operation incl. the operation itself. |
||||||||
Code / Index / Variant / Description Resource |
Shows the Code / Index / Variant or description of the assigned resources. |
||||||||
Q x F |
Quantity x Frequency |
||||||||
Share |
Corresponds to the percentage share of the analyzed time in the evaluated process indicator, if operations have been assigned to more than one process indicator. |
||||||||
Time value [time unit] |
Shows the time value of the operations in the selected time unit. The ABC analysis is carried out using this column. Using the drop-down selection for the sorting in the "Filter" ribbon, you control the time used for classification, i.e. which time value is involved. |
||||||||
Time type tg, tg total, trg, trg default, te, te total, tr, tr total [time unit] |
Displays the time in the corresponding time type in the selected time unit. Time type total shows the time in the corresponding time type while taking "Q x F" into account. |
||||||||
% |
Percentage share of the operation within the ABC analysis |
||||||||
cum. % |
Cumulated percentage share of the activities within the ABC analysis. All activities with equal or smaller ranking number are summarized. |
||||||||
Process indicators |
One of three possible process indicators, which can be used to evaluate according to specific aspects. |
Note: |
Double-clicking the Rank column, opens the Operations tab, selects the relevant row and shows it. |