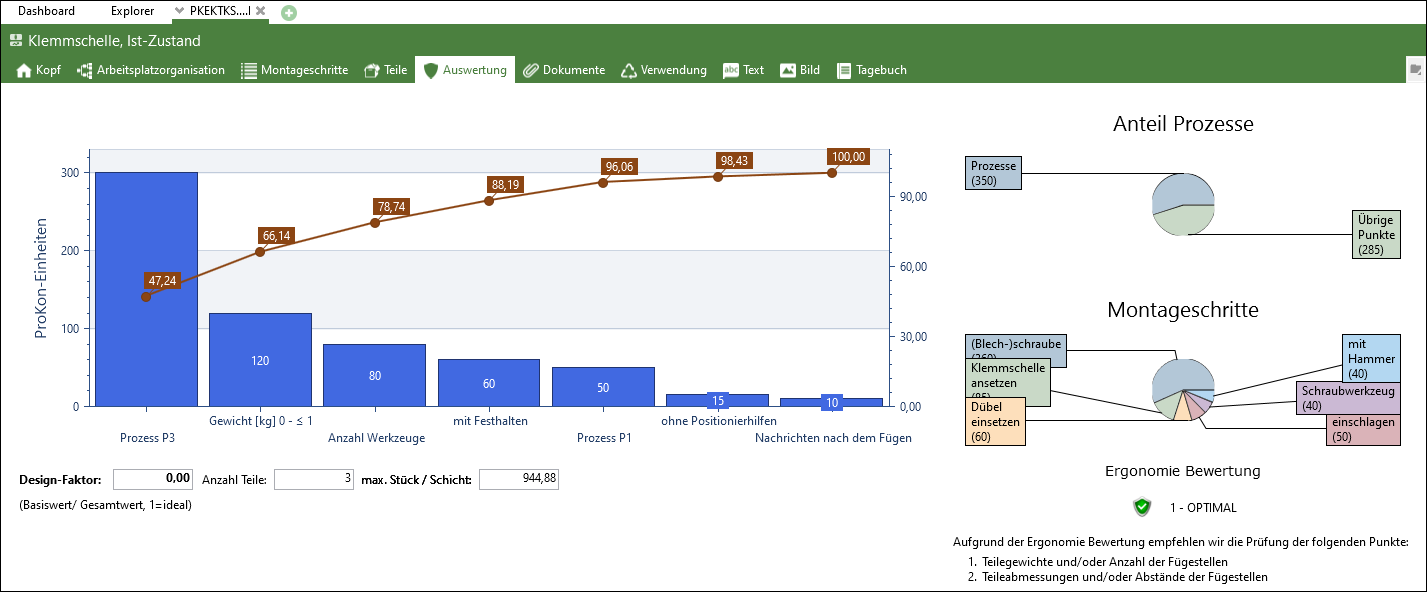
In the Evaluation tab all assembly steps of an analysis are displayed graphically.

Tab evaluation of a ProKon E analysis
In the bar chart, the ProKon categories are sorted by size in descending order by ProKon units. The optimization potential is represented by a brown line (= potential). The potential of a category is calculated as follows: Units of a ProKon category divided by total units. The line indicates the optimization potential in %. 100 % means that there is no need for optimization at this point.
In the upper pie chart the shares of the processes (P1, P2, P3) and the other points are shown as sum of the units.
The lower pie chart shows the units of the individual assembly steps in which a component is installed.
Please note: |
•A maximum of 16 assembly steps are displayed in the pie chart; from the 17th assembly step onwards, the x-16 smallest assembly steps are combined as a group. •In the evaluation, the ergonomics evaluation is only shown for ProKon analyses with ProKon E structural behavior. |
It is also possible to save the individual diagrams of the evaluation as picture. When moving the mouse pointer over the respective diagram, an export symbol appears in the upper right corner. By clicking on the icon the image can be saved as *.jpg or *.bmp file.