In this tab it is possible to include improvement measures. These measures are immediately shown as an interactive waterfall chart.
Improvement measures can be estimated or operations with an indicator can be calculated.
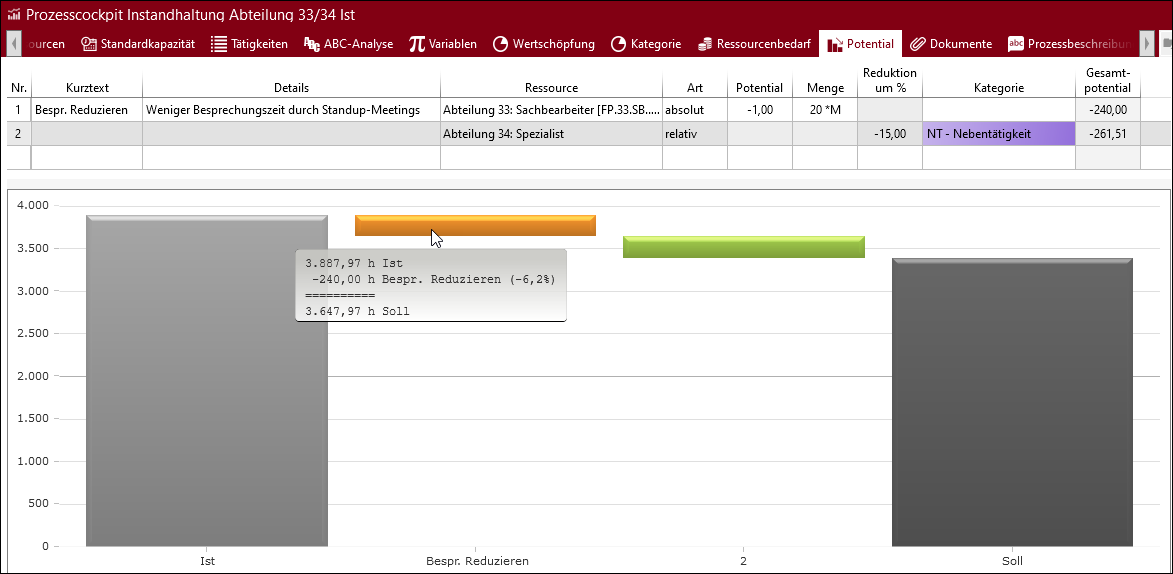
All operations of a "Reduction of %" or "Reduction of an operation" category. In this example, -1 h, 20 times per month.
There are two ways of calculating potentials. They are selected by the "Type" column and thus defines the possible entries.
•Absolute (fix): Entering values in the "Potential" and "Quantity" columns
•Relative: Entering a value in the "Reduction of %" column
By selecting a resource in the "Resource" column, the potential is calculated based on all operations of this resource. If no option is selected, the potential refers to all operations of the whole process cockpit element. Furthermore, it is possible to calculate the potential based on process indicators, such as category.
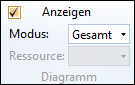
Adjusting the display of the chart in the Potential tab
In the "Potential" ribbon in the "Chart" area, you can use the drop-down lists "Mode" and "Resource" to control how the data is displayed in the chart. In addition, you can activate or deactivate the display of the chart.
Note: |
Detailed values for potential improvements can be found in the tooltips at the diagram. |